Soil Data Management System
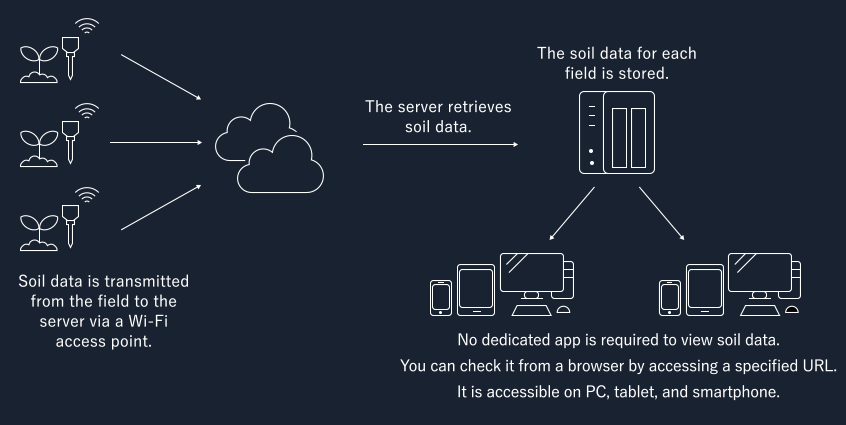
A web-based system that accumulates and displays sensor data transmitted by garden sensors in an on-premises storage environment.
Development Overview
We accumulate soil data sent from garden sensors to on-premises storage and analyze invisible soil data.
Display data
- Temperature, Humidity, Light Intensity, EC (Electrical Conductivity) Value, Soil Moisture, Battery
This is the data sent by the garden sensor. - Dew Point, Relative Humidity
Calculations are performed using the data sent by the garden sensor. - Average Temperature, Accumulated Temperature
Calculations are made based on past temperature data.
Operating environment
| Web browser | Google Chrome |
|---|
Development Contents

Function
Data accumulation
- Sensor data is accumulated in the database every 10 minutes.
Sensor Information List Display
- Sensor List Screen
- Display Sensor Information in List
Sensor Data Viewing
- Sensor Data Viewing Screen
- Retrieve sensor data values for the selected ID from the database on the sensor list screen.
- Display the retrieved values and calculated values on the screen.
Sensor Data Graph Screen
- Retrieve sensor data values from the database for the selected ICID on the sensor list screen.
- Display graphs and values for the specified sensor data and time interval in 10-minute increments.
- Humidity and water temperature are displayed in a line graph.
- Temperature, Dew Point, Relative Humidity, Light Intensity, and EC Value are displayed in bar graphs.
- Display daily bar graphs and values for the specified period's average temperature and accumulated temperature.
Development Environment
| OS | Linux |
|---|---|
| Database | mongoDB |
| Framework | Laravel |
| Programming language | PHP |
| Other |
|
* The service has been discontinued.
-
- ADC
- Sensor
- Power management
- Oscillator
- Motor control
- Audio
- Development of a sensor image evaluation system for automotive applications
- Development of a hardware platform for OpenCV implementation in automotive applications.
- Development of industrial camera systems
- CIS digital design
- Digital circuit design for mixed-signal LSI.
- Digital signal processing design